

 This week, we got a smorgasbord of jobs data — JOLTS, ADP, weekly jobless claims, and the nonfarm payrolls (NFP). Friday’s NFP, the big one the market was waiting for, showed that 139,000 jobs were added in May, which was better than the expected 130,000. Unemployment rate held steady at 4.2%, and average hourly earnings rose 0.4% for the month.
The stock market rallied on the news. The S&P 500 rose above the 6000 level and closed slightly above it. That’s the first time the index has hit the 6K level since February. And the party wasn’t just in the S&P 500. All the major stock market indexes closed higher, and the Cboe Volatility Index ($VIX) closed below 17, suggesting investors are pretty complacent.
Sector Performance: Tech Takes the Lead
When you look at which sectors did best this week, it’s pretty clear that Technology was leading the charge. But is the leadership as strong as it was last year?
To answer, we can begin by taking a look at the MarketCarpet for S&P Sector ETFs below. It clearly illustrates the strength of the Technology sector.

FIGURE 1. WEEKLY PERFORMANCE OF THE S&P SECTOR ETFS. Technology is in the lead while Consumer Staples is the laggard.Image source: StockCharts.com. For educational purposes.
Now, if you drill down, it’s evident from the MarketCarpet of the Technology Sector that heavily weighted large-cap stocks, across the many different categories within the sector, displayed strong performance for the week.

FIGURE 2. WEEKLY PERFORMANCE OF TECHNOLOGY SECTOR. Large-cap heavily weighted stocks were in the green this week.Image source: StockCharts.com. For educational purposes.
Semis Grind Higher
Within tech, the semiconductors look especially strong, with several dark green squares in the MarketCarpet. This warrants a closer look at this industry group.
The weekly chart of the VanEck Vectors Semiconductors ETF (SMH) shows an upside move, with the ETF trading above its 40-week simple moving average. However, SMH is still underperforming the SPDR S&P 500 ETF (SPY). The Relative Strength Index (RSI) is trending higher and is in better shape since the end of March, but needs to gain more momentum to push it into overbought territory.
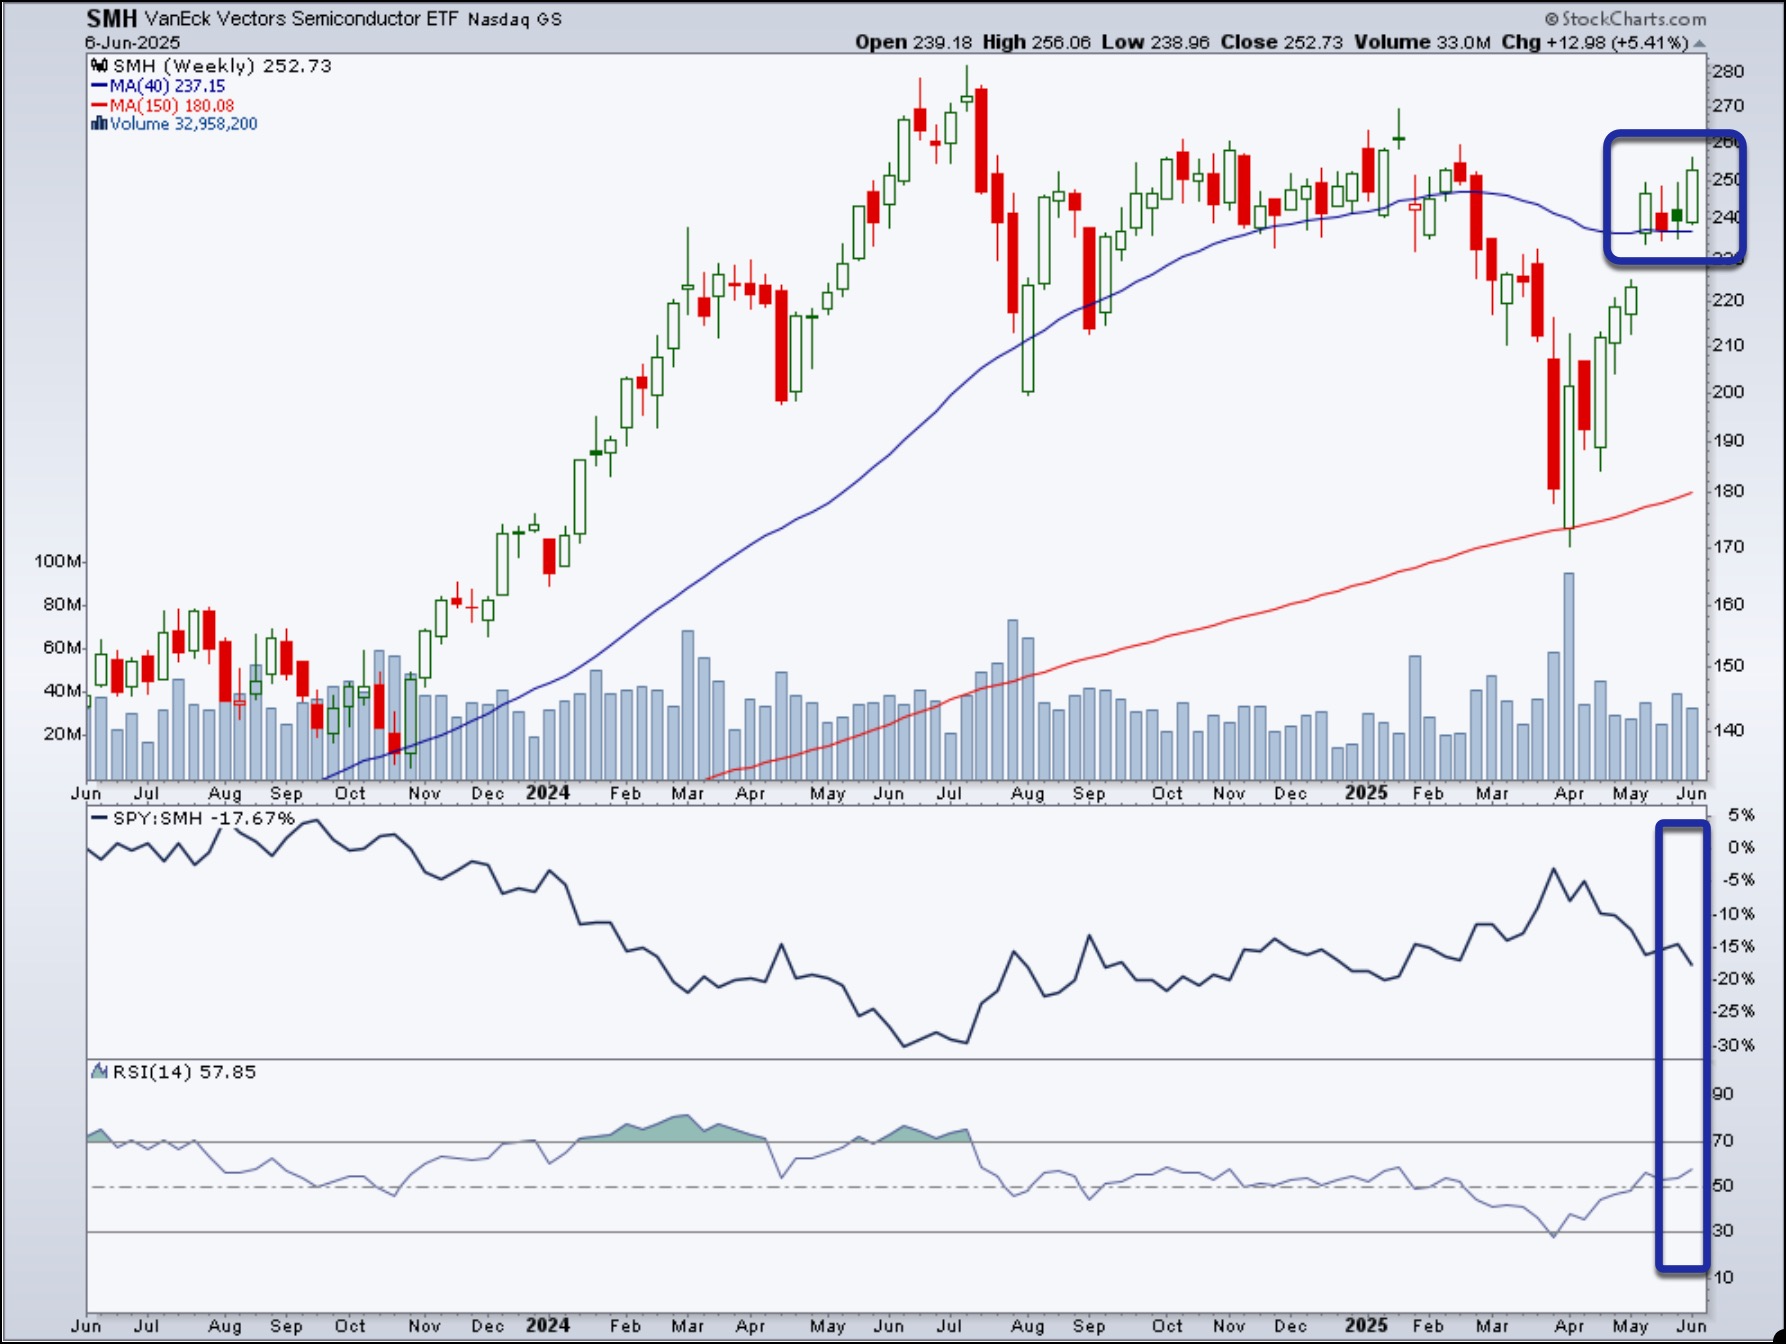
FIGURE 3. WEEKLY CHART OF VANECK VECTORS SEMICONDUCTOR ETF (SMH). While the price action in SMH is leaning towards the bullish side, it’s underperforming the SPY and needs more momentum.Chart source: StockCharts.com. For educational purposes.
If SMH continues to move higher with strong momentum, it would be a positive indication for the equity markets. However, there are several moving parts that investors should monitor.
Closing Position
While stocks are inching higher on low volatility, news headlines disrupt trends, sometimes drastically.
The weakening U.S. dollar and rising Treasury yields can sometimes signal headwinds for the stock market. Next week is going to be all about inflation, and we’ll get the Consumer Price Index (CPI) and Producer Price Index (PPI) for May.
With the job numbers in the rearview mirror, investors will be focused on inflation, especially since the Fed meets the following week. As of now, the Fed isn’t expected to make any changes to interest rates until perhaps their September meeting. Let’s see if next week’s inflation data changes the picture.
Watch the price action unfold by monitoring the StockCharts MarketCarpets and the StockCharts Market Summary page.

Disclaimer: This blog is for educational purposes only and should not be construed as financial advice. The ideas and strategies should never be used without first assessing your own personal and financial situation, or without consulting a financial professional.